PERFORMANCE TESTING
Benchmarking Smile CDR at Scale in AWS
Read about our latest ground-breaking performance and scalability benchmarks of 255,087 interactions per second here.
Benchmarks are the worst. Yet, there is a lot of trust afforded to them. As a techie-at-heart benchmarks are the bane of my existence for a few reasons:
-
They are often cherry-picked measurements: If someone wants to show that their widget is better than your widget, they can usually find a way of comparing them that will put their widget on top even if yours is better in every other way.
-
They are often hard to reproduce: Most of us don't exactly have an appropriate testing lab available, assuming enough detail about the methodology used is shared.
-
They are often unreliable indicators of real-world performance: Ultimately, unless you are looking to use the widget in exactly the same way it was tested, can you really rely on the numbers to predict how you will fare?
-
The numbers often don't even matter: Let's be real here, you will never read a car review that doesn't speak of its top speed or a phone review that doesn't speak of how much RAM it has. I'm sure some people have, but I'm pretty sure I've never run out of memory on my phone and I've certainly never come close to reaching the top speed of any car I've owned. Rather than focus on the speed, where's the benchmark on how easy it is to put your drink back into the cupholder while navigating an unexpected turn?
Instead of artificial numbers, I always prefer to let our actual track record and reputation speak for us. Smile Digital Health's technologies are already successfully deployed by some of the biggest provider and payer organizations, software companies, and government institutions around the world. We have proven our ability to scale as big as needed, over and over.
Benchmarks are ultimately data points, and more data is almost always better than less data. So in that spirit, I have done my best to present a benchmark that avoids the pitfalls above and to provide useful data points.
The Scenario
Building up on my assertion regarding unreliable indicators, I endeavored to set up a scenario that is both realistic and detailed enough that will still be helpful, even if it isn't exactly your scenario. Fortunately, 2021 was an interesting year at Smile, and we have lots of experience to draw on.
If you weren't paying attention, July 2021 was the target date that CMS-impacted US Healthcare Payers were mandated to begin providing consumer-facing APIs for data access. We helped quite a few organizations on that journey. So let's take that use case as our starting point.
In this benchmark we modeled a medium-sized payer, with one million patients to load along with a big pile of data for each one. We did the following:
-
Step 1: Simulate back-loading a big historical pile of data into the system
-
Step 2: Simulate consumer (member) access by performing typical Carin IG for Blue Button® queries for many different members concurrently
-
Step 3: Simulate an operational server by performing other typical FHIR operations concurrently.
The Software
In this benchmark we used a published build of Smile CDR. Smile CDR is a full featured healthcare data fabric with HL7 FHIR at its core.
Unlike many other options in this space, Smile is designed to AVOID vendor lock-in. It can be deployed using a variety of storage engines, in a variety of deployment models, in a cloud of your choosing or on your own premises.
Smile is powered by HAPI FHIR, the world's most popular open source implementation of the HL7 FHIR standard. Although it would require some additional tuning work to configure HAPI FHIR in a functional cluster, the results presented here should also be achievable with HAPI FHIR.
The Setup
|
Application Host Servers |
Note: Either 4 or 6 servers of these specifications were used, depending on the specific test. Details are provided below. |
|
JVM |
|
|
Application |
|
|
Database Platform |
|
|
./run_synthea -p 1000000 |
-
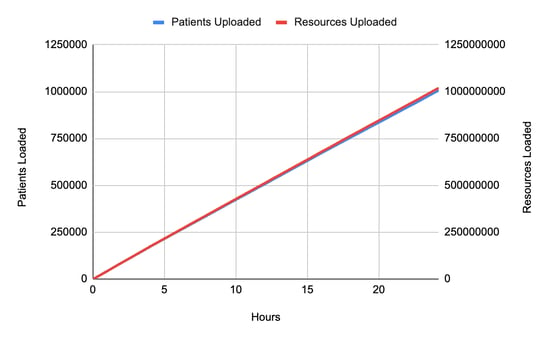
1,005,500 complete patient files (we will refer to this as "1 million patients" below)
-
1,018,713,827 resources
-
This works out to an average of 1012 resources per patient
-
2.182 TiB of raw FHIR data.
-
If maximizing ingestion speed is important, you really can't beat the performance of Channel Import using Kafka.
-
Larger FHIR transactions (i.e., a FHIR transaction containing many resources) provide much faster overall performance than single-resource HTTP transactions.
-
Parallelizing your load is critical, and should be done in a way that avoids conflicts (i.e, the same resource being created/updated by two parallel threads). Kafka can help here too, if appropriate partition keys are used.
-
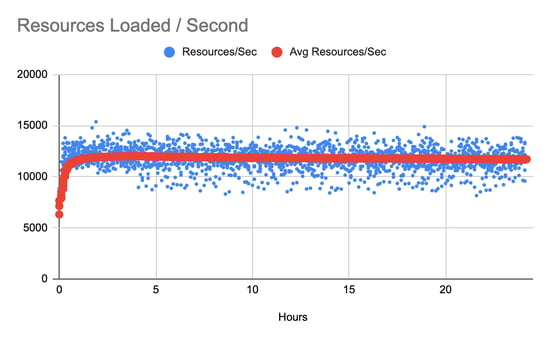
11.6 complete patient records per second
-
11,716.6 resources per second.


 This figure shows Smile CDR cluster processes self-reporting CPU utilization across the cluster. As these VMs have 4 vCPU each, 400% would indicate a maxed-out server. |
-
First, 5,000 patient IDs were captured from the database, in order to provide a collection of resource IDs that could be used as parameters for the searches being performed. Note that this step is considered to be test fixture setup and was not included in the benchmark numbers.
-
Then, searches were performed loading resource collections for individual patients. Initially these searches were performed in a single-threaded fashion, and user concurrency was gradually increased to a final setting of 200 concurrent users. Every search used a randomly chosen patient ID from the initially loaded collection.

This figure shows search latency as user concurrency is increased. The large variation in 99th percentile requests appears to have been caused by garbage collection cycles. |
Processor capacity in the 4-process cluster is shown below.
|
This chart shows processor usage during the search tests. |
Step 3: Typical FHIR Operations
In this part we simulated several other FHIR operations being performed concurrently. We used the same ramping methodology as in part 2. This means that for each operation shown in this section, we performed it a total of 597,000 times.
FHIR Create
For this test we performed a FHIR create.
The methodology for this test was as follows:
-
First, 5,000 patient IDs were captured from the database, in order to provide a collection of resource IDs that could be used as subject references for the resources being created. Note that this step is considered to be test fixture setup and was not included in the benchmark numbers.
-
Then, Observation resources were created with a subject (Observation.subject) corresponding to a randomly selected patient from the collection.
The test was repeated from one concurrent user up to 200 concurrent users.
|
|
FHIR Update
In this test we performed a FHIR update.
The methodology for this test was as follows:
-
First, 5,000 patient IDs were captured from the database, in order to provide a collection of resource IDs that could be used as parameters for the reads being performed. Note that this step is considered to be test fixture setup and was not included in the benchmark numbers.
-
Then, an update is performed as follows:
-
A random patient is selected from the loaded collection
-
If the patient has a gender of "male", an update is performed that sets this to "female"
-
If the patient has a gender of "female", an update is performed that sets this to "male"
-
If the patient has a gender of "other" or "unknown", an update is performed that does not change any attributes (a NOP).
-
 |
FHIR Read
For this test we performed a FHIR read.
The methodology for this test was as follows:
-
First, 5,000 patients were loaded from the database, in order to provide a collection of resource IDs that can be used as parameters for the searches being performed. Note that this step is considered to be test setup and was not included in the benchmark numbers.
-
Then, an individual FHIR read was performed for a randomly selected Patient from the collection.
The test is repeated from one concurrent user up to 200 concurrent users.
 |
Conclusions
To recap, this benchmark shows data ingestion using a commonly used technique (FHIR Transactions) and achieves overall performance of 11,716.6 resources per second.
We also ran several other common FHIR server scenarios, and achieved the following results at 50 concurrent users (which is a realistic number for the given scale of data and hardware size).

It's worth pointing out a few things about this benchmark:
We are only testing one platform combination here: Smile CDR + EC2 + Aurora RDS (Postgres). Smile supports many different database technologies and deployment models, each of which come with their own advantages and disadvantages. We plan on releasing additional benchmarks in the future using other stacks in order to provide guidance on what combinations work well.
We only tested one backload mechanism: As I mentioned at the outset, Channel Import (Kafka) has traditionally been our best performing option. ETL Import (CSV) has typically performed adequately but not spectacularly, with the tradeoff being that it is very easy to work with if your source data is tabular.
We optimized our search parameters: The FHIR specification contains a huge collection of "default" search parameters. Leaving them all enabled is almost never useful, and more importantly will almost always reduce performance to some degree and increase storage space.
Most importantly, we focused only on FHIR storage and retrieval here. While our HAPI FHIR engine has been around as long as any offering on the market (and in most cases, much longer), there are many other options out there too. Of course, you want good performance, but I suspect every major solution on the market today can be configured to achieve perfectly acceptable performance and scalability. My own opinion here is this: anyone who tries to use speed as their selling point is probably trying to skirt the fact that their system doesn't offer much else.
People choose Smile because they want a complete package: Need the most comprehensive support for the FHR standard you can find? Check. Need Master Data Management capabilities? Check. Need a reliable pub/sub mechanism? Check. Need HL7 v2.x or CDA interoperability? Check. Need platform independence? Check. Need a partner that can demonstrate a long track record of success in health data and an industry-leading focus? Check.
Need great performance? Yeah, of course, Check.


